Motivation
The inferences we’ve covered so far relied on our assumption of Normal errors: \[ \epsilon \sim N(0, \sigma^2 I_{n\times n}) \]
For example, we’ve seen under this assumption, the least squares estimates are also Normally distributed: \[ \hat{\beta} \sim N\left(\beta,\, \sigma^2 \left(X^{T}X \right)^{-1} \right) \]
If the errors aren’t truly Normally distributed, what distribution do the estimates have?
Warm-up: Your Turn
Imagine the errors are in fact \(t_{3}\) distributed?
With your neighbour: design a simulation to understand the distribution of the least squares estimates.
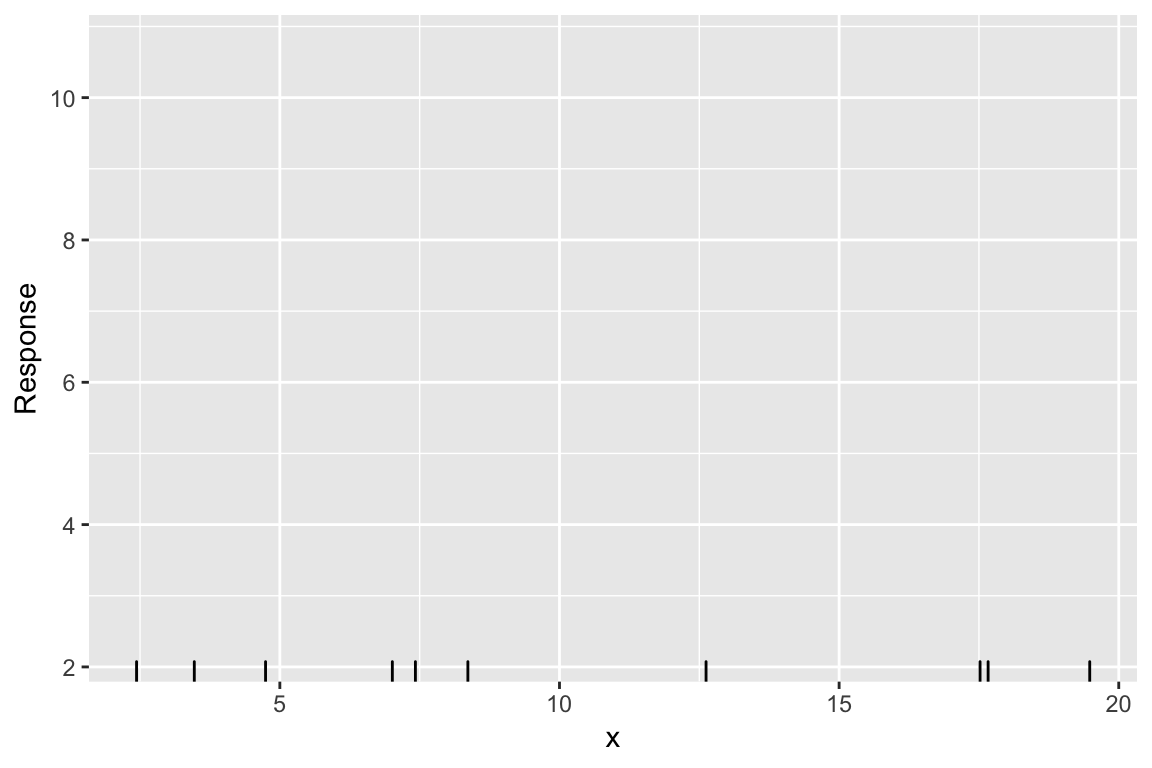
Example: 1. Fix n, fix X
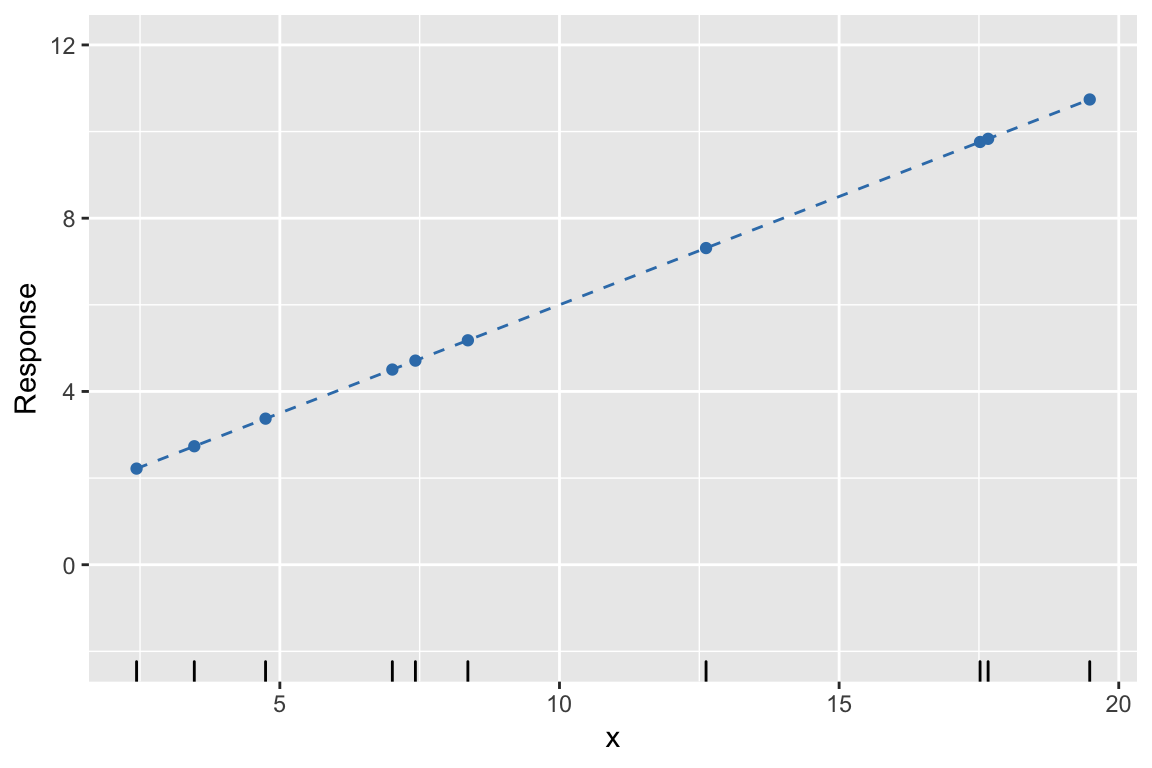
Example: 1. Fix \(\beta\), find \(\hat{y}\)
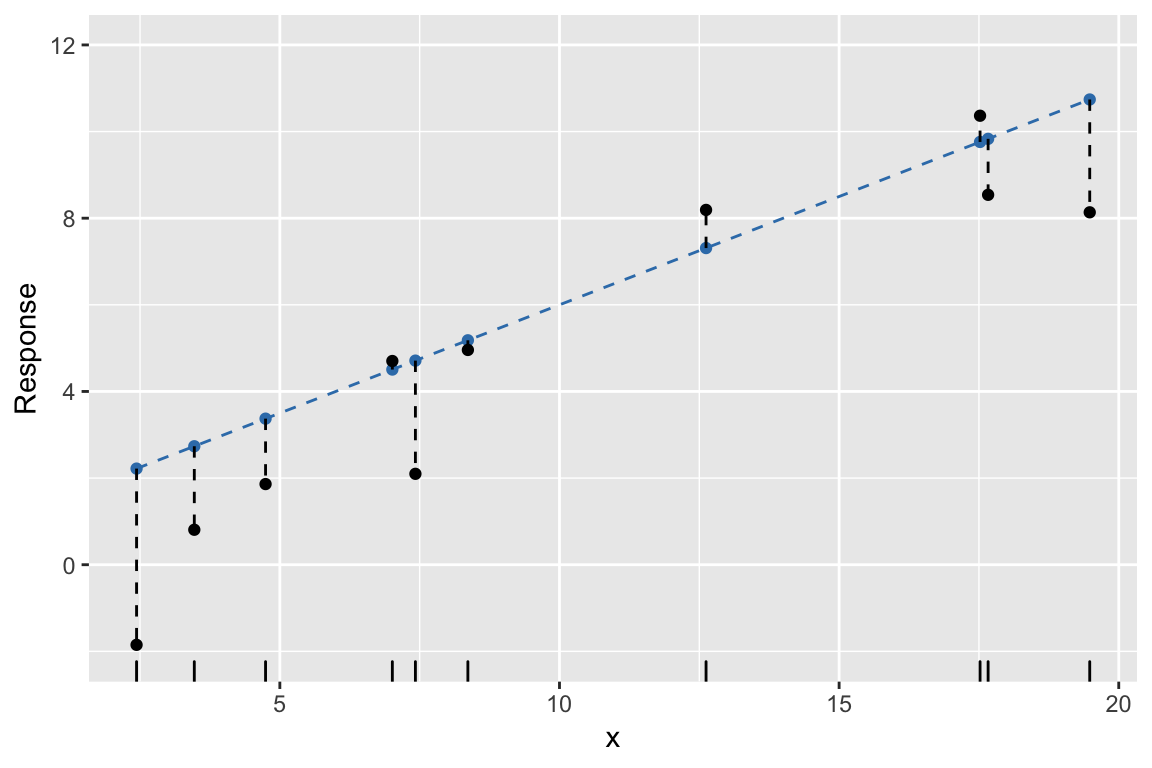
Example: 2. Simulate errors, find \(y\)
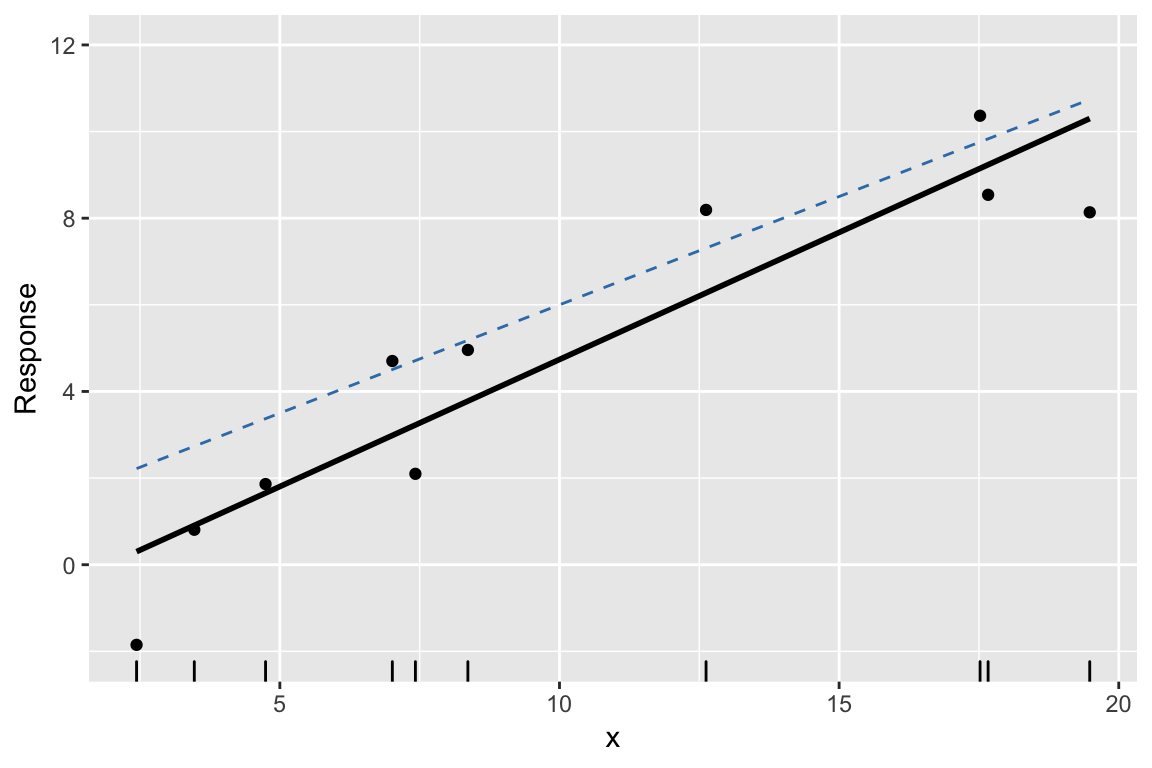
Example: 3. Find least squares line
Example: 4. Repeat #2. and #3. many times
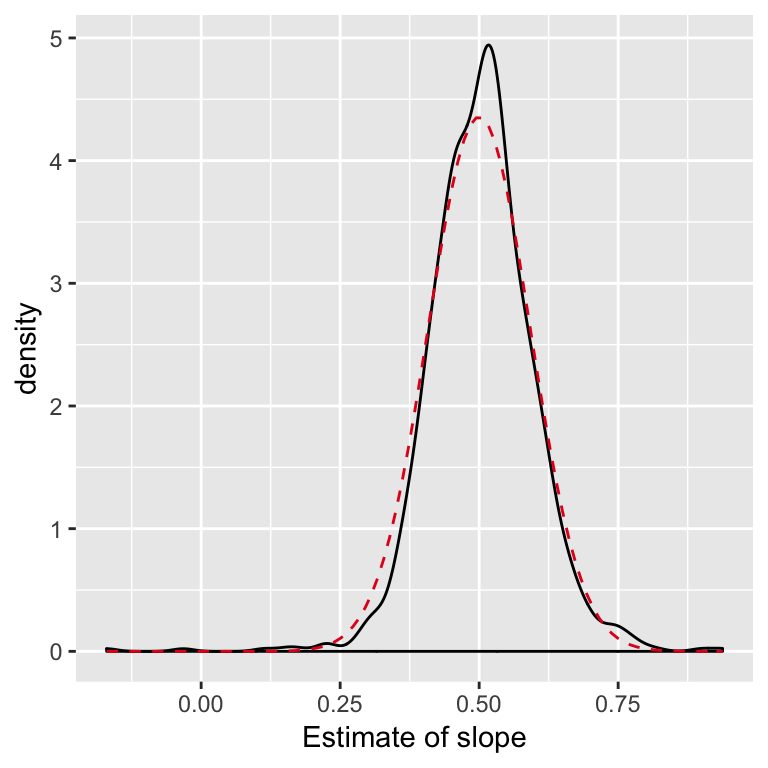
Example: Examine distribution of estimates
Example: Compared to theory
When the errors aren’t Normal: CLT
Think of our estimates like linear combinations of the errors. I.e. a sort of average of i.i.d random variables.
Some version of the Central Limit Theorem will apply.
For large samples, even when the errors aren’t Normal, \[ \hat{\beta} \dot{\sim} N(\beta,\, \sigma^2 (X^TX)^{-1}) \]
Summary so far
If we knew the error distribution and true parameters we could use simulation to understand the sampling distribution the least squares estimates.
Simulation can also be used to demonstrate the CLT at work in regression.
Bootstrap confidence intervals
In practice, with data in front of us, we don’t know the distribution of the errors (nor the true parameter values).
The bootstrap is one approach to estimate the sampling distribution of \(\hat{\beta}\), by using the simulation idea, and substituting in our best guesses for the things we don’t know.
Bootstrapping regression
(Model based resampling)
0. Fit model and find estimates, \(\hat{\beta}\), and residuals, \(e_i\)
- Fix \(X\),
- For \(k = 1, \ldots, B\)
- Generate errors, \(\epsilon^*_i\) sampled with replacement from \(e_i\)
- Construct \(y\), using the model, \(y = \hat{y} + \epsilon^*\)
- Use least squares to find \(\hat{\beta}^*_{(k)}\)
- Examine the distribution of \(\hat{\beta}^*\) and compare to \(\hat{\beta}\)
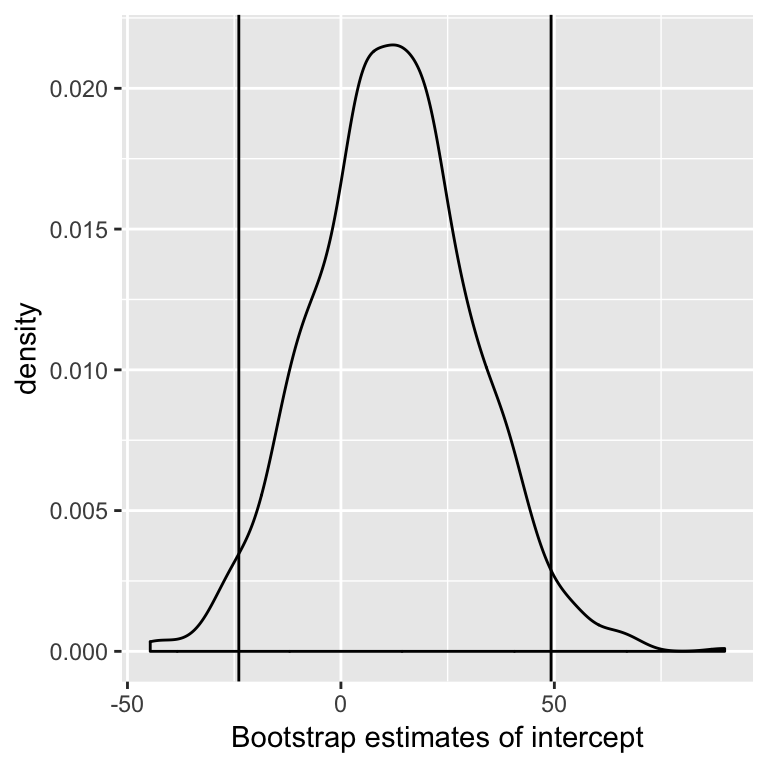
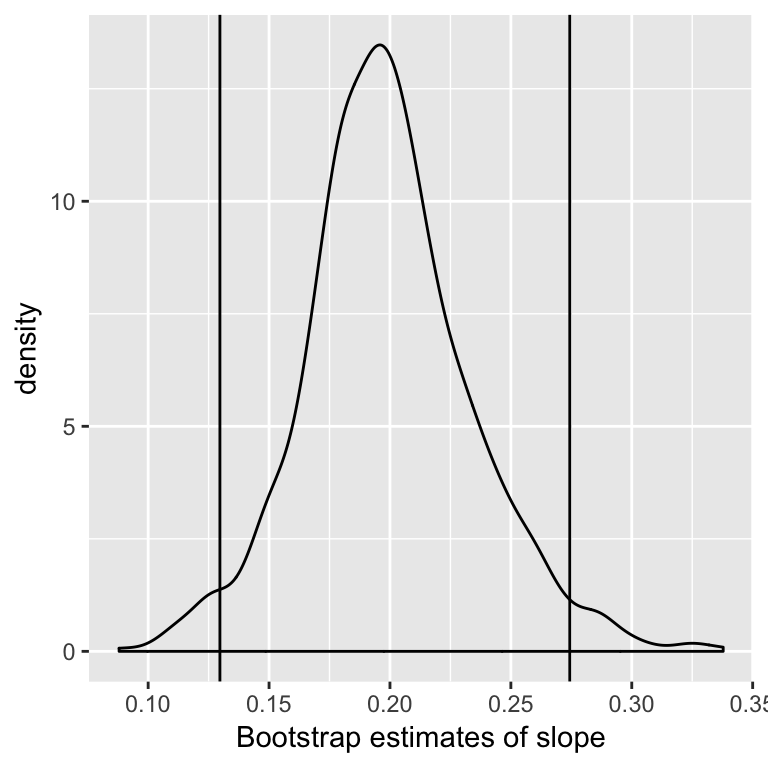
One confidence interval for \(\beta_j\) is the 2.5% and 97.5% quantiles of the distribution of \(\hat{\beta}_j^*\).
(Known as the Percentile method, there are other (better?) methods).
Example: Faraway Galapagos Islands
(I’ll illustrate with simple linear regression, Faraway does multiple case in 3.6)
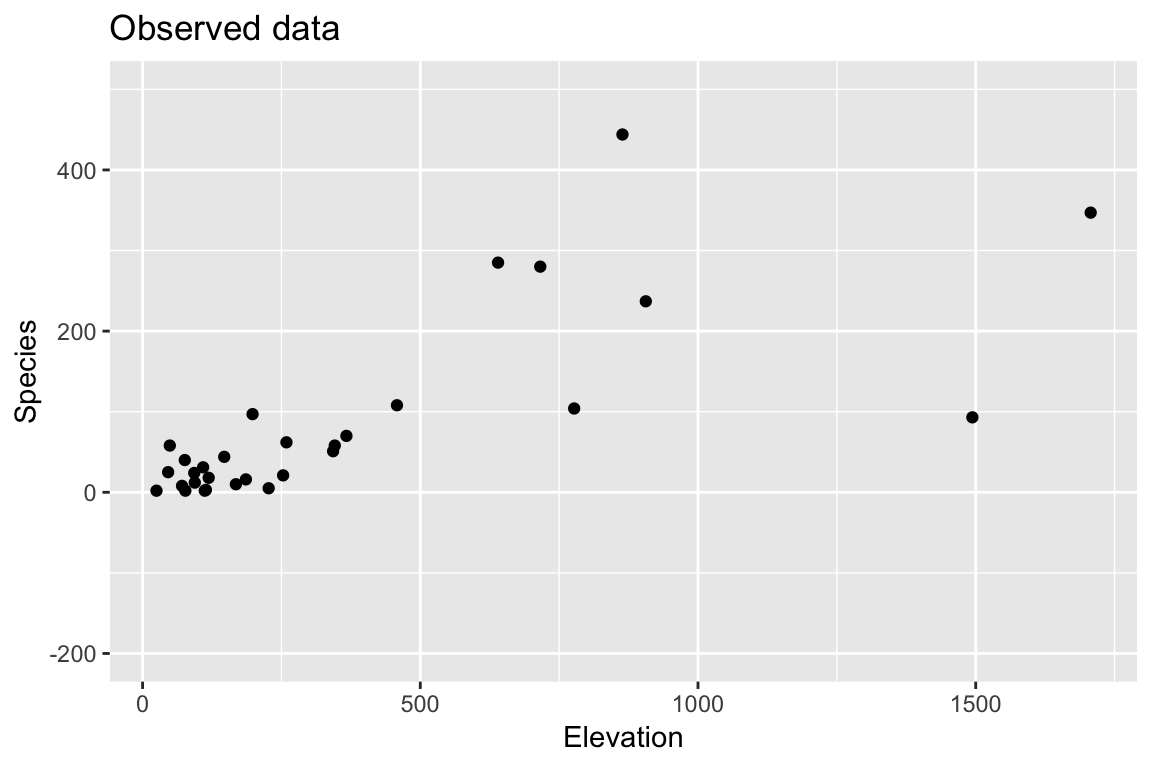
Bootstrap: 1. Find \(\hat{\beta}\), \(\hat{y}\), and \(e_i\).
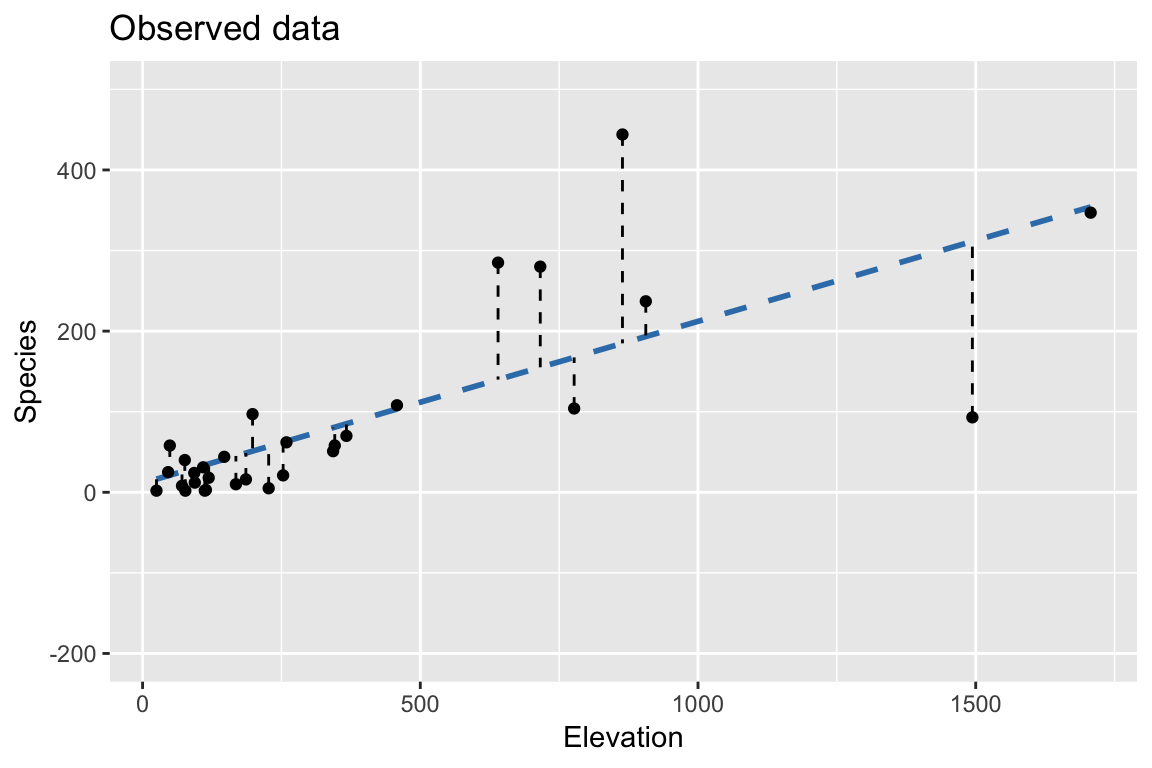
Bootstrap: Using fixed \(X\), \(\hat{beta}\) from observed data
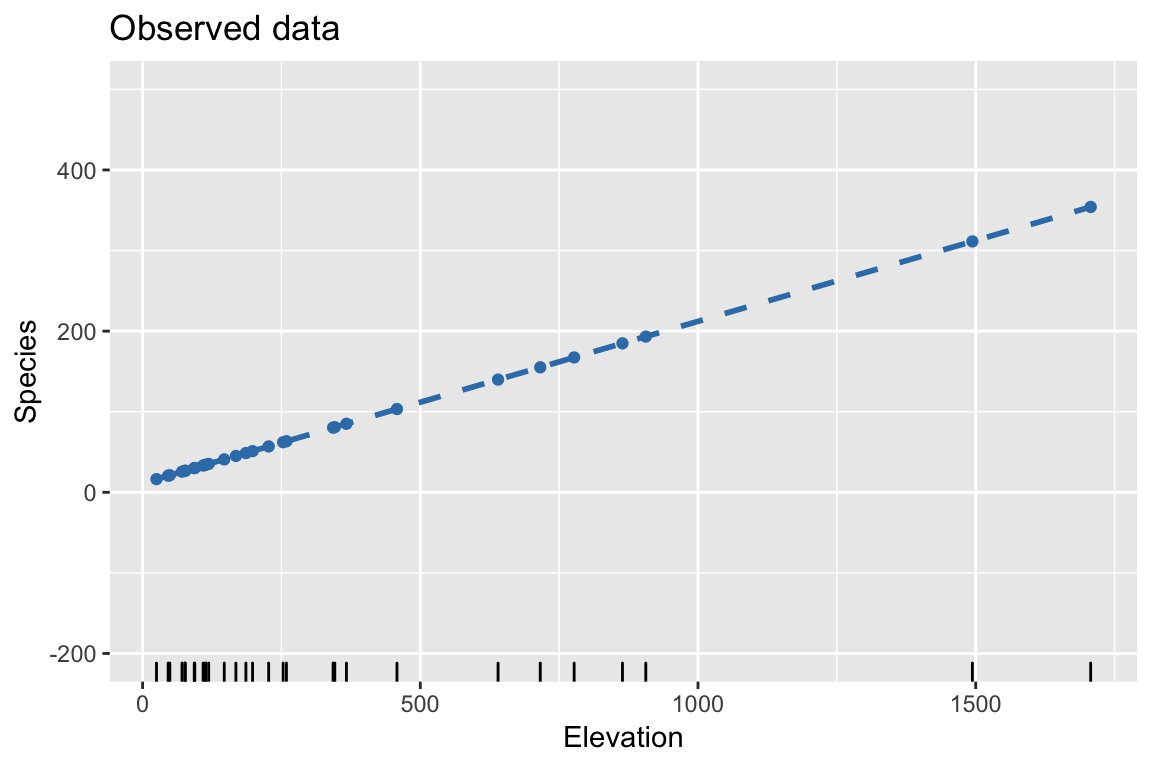
Bootstrap: 2. Resample residuals to construct bootstrapped response
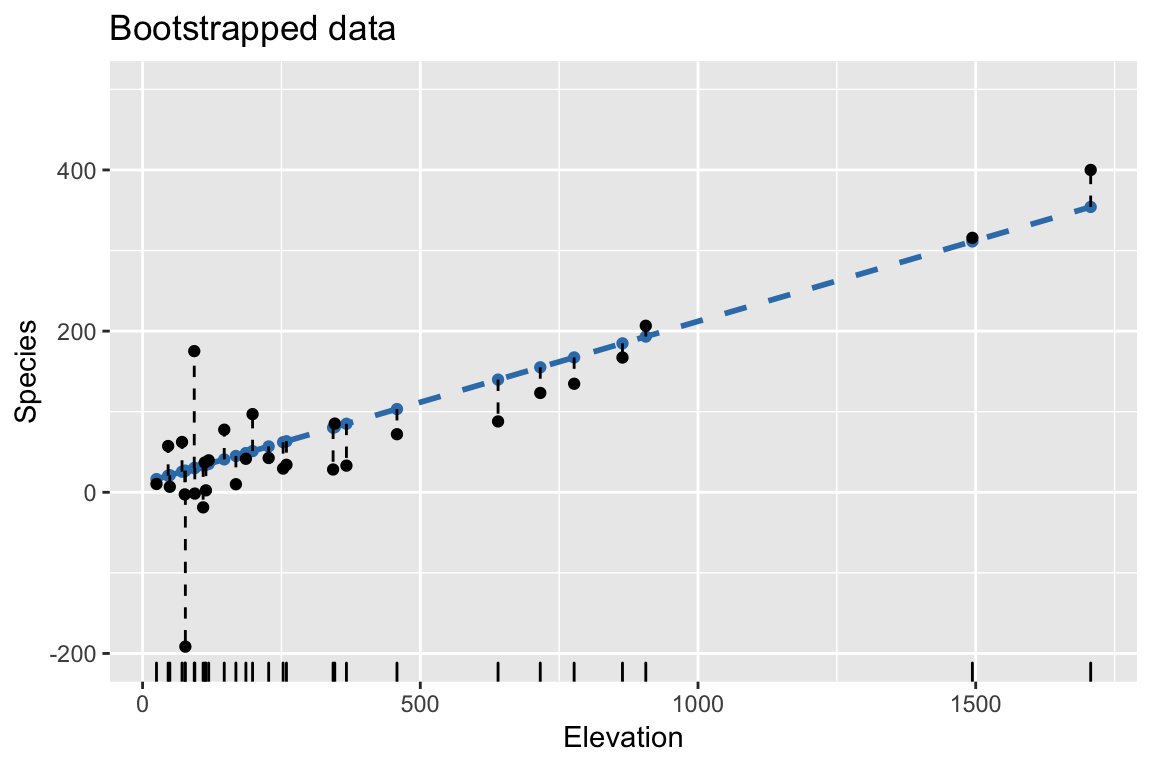
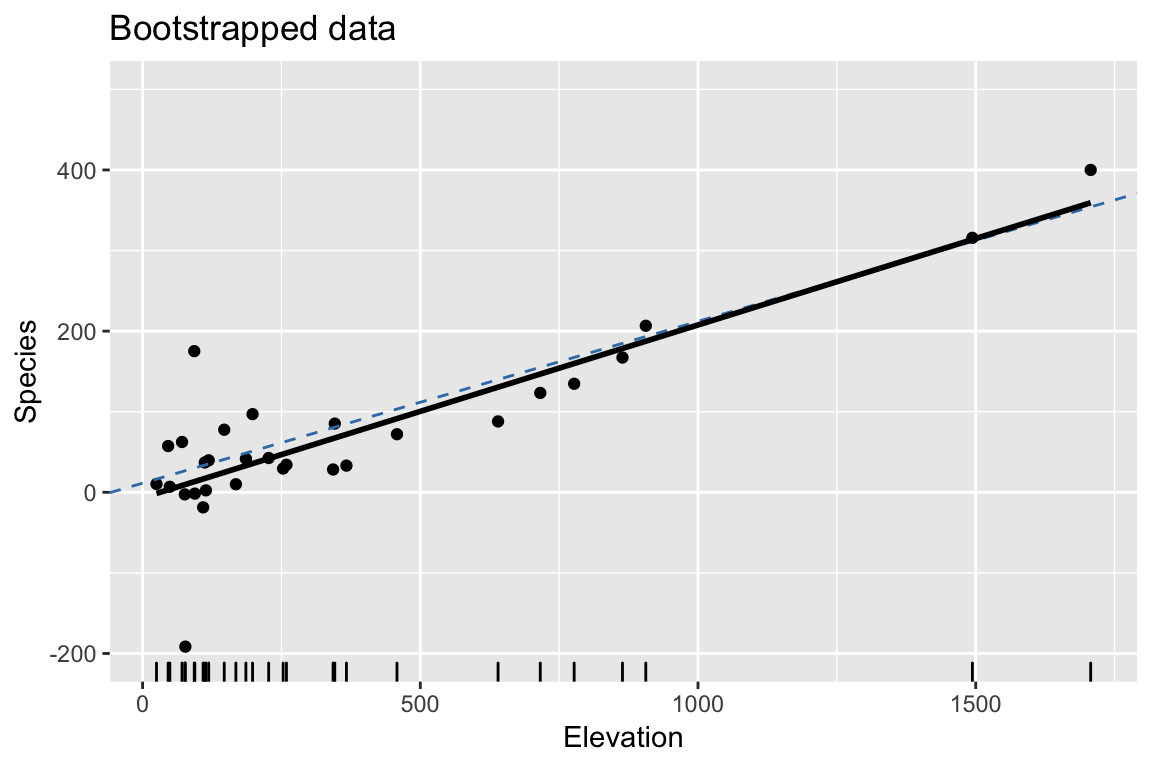
Bootstrap: 3. Fit regression model to bootstrapped response
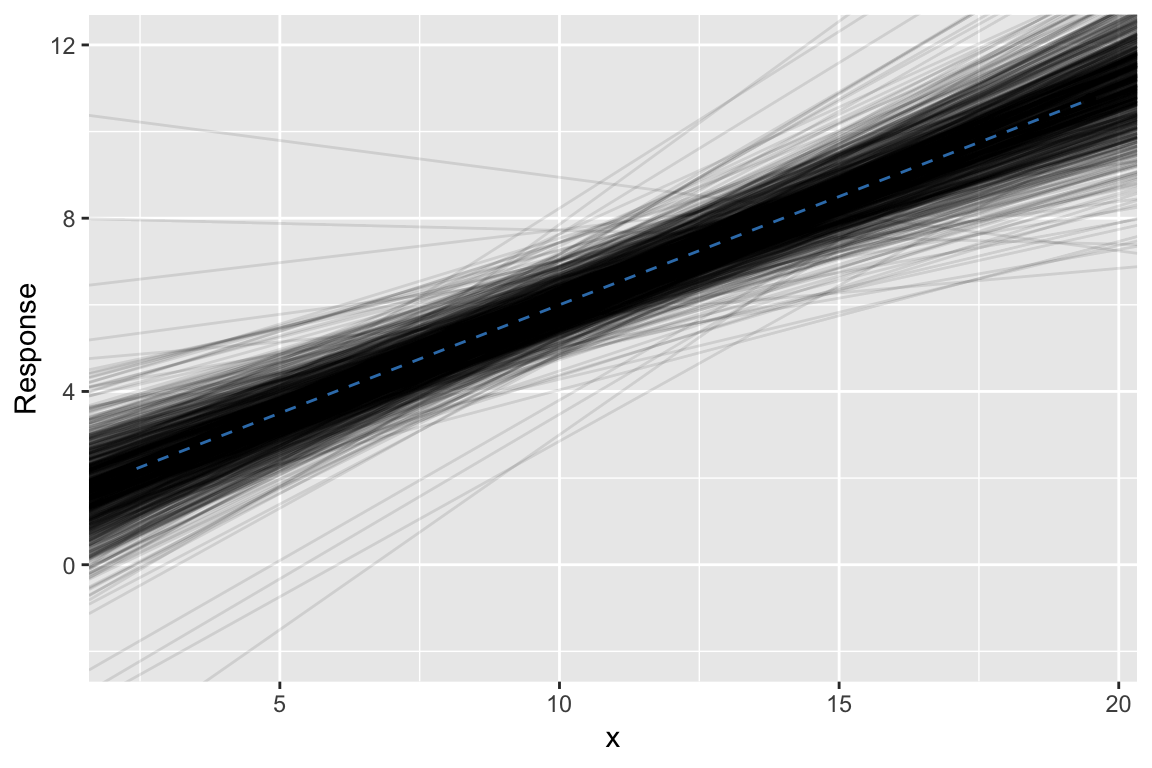
Bootstrap: 3. Repeat #2. and #3. many times
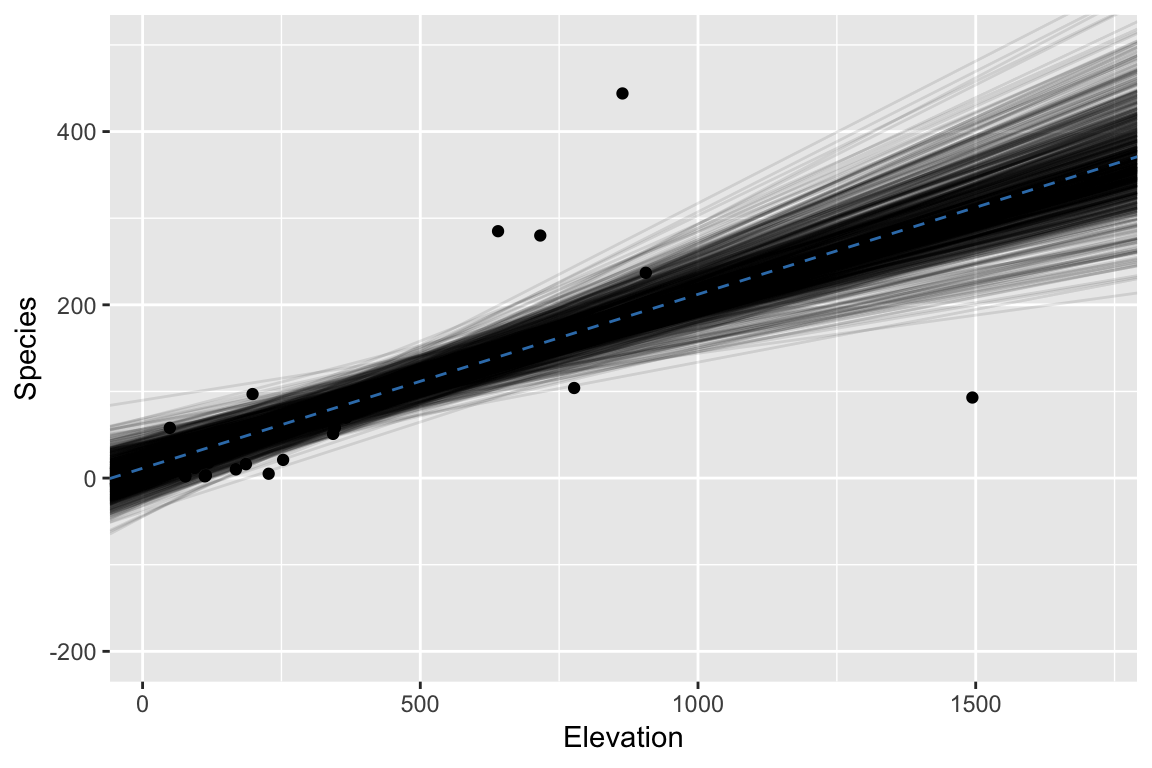
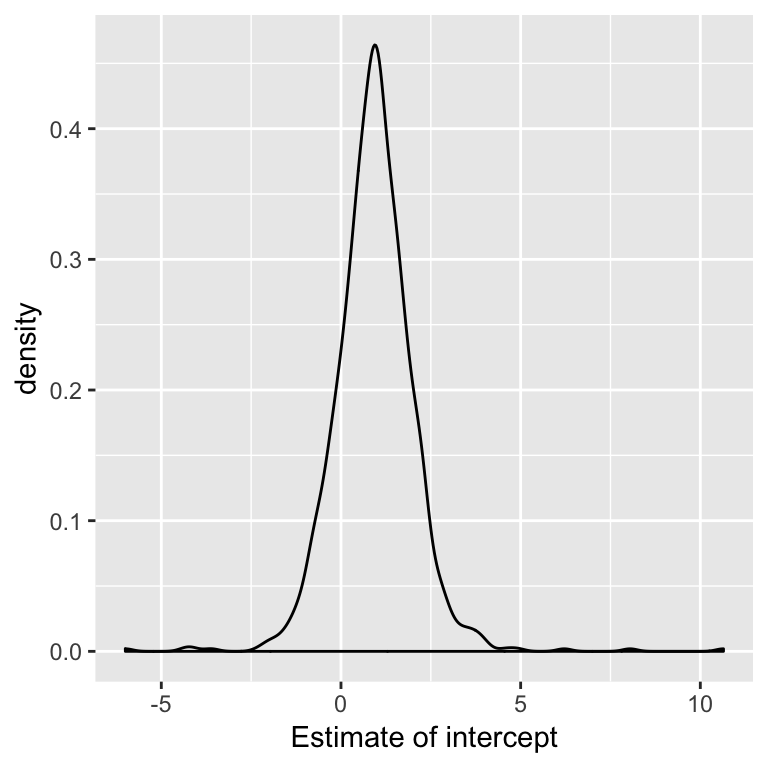
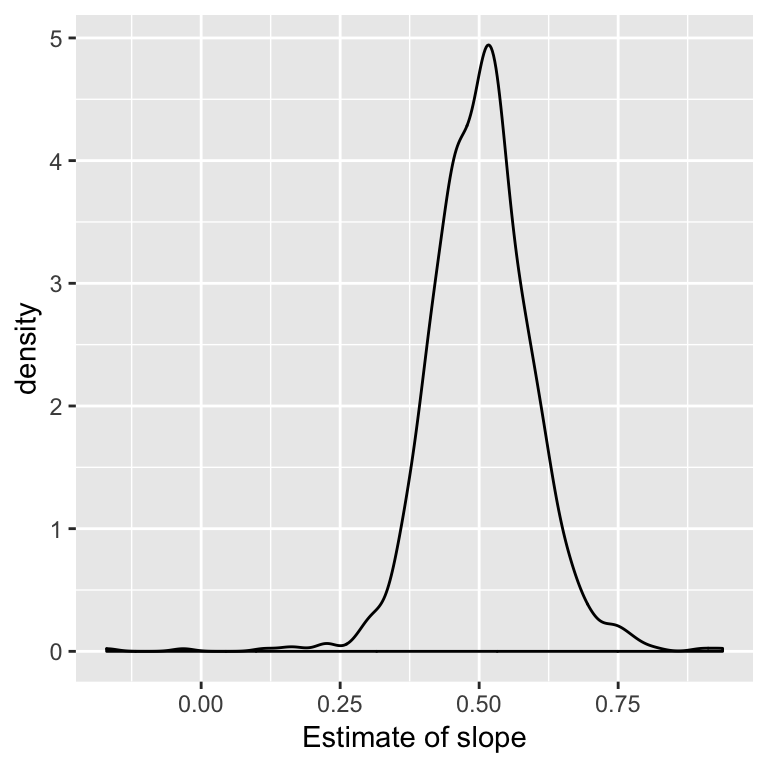
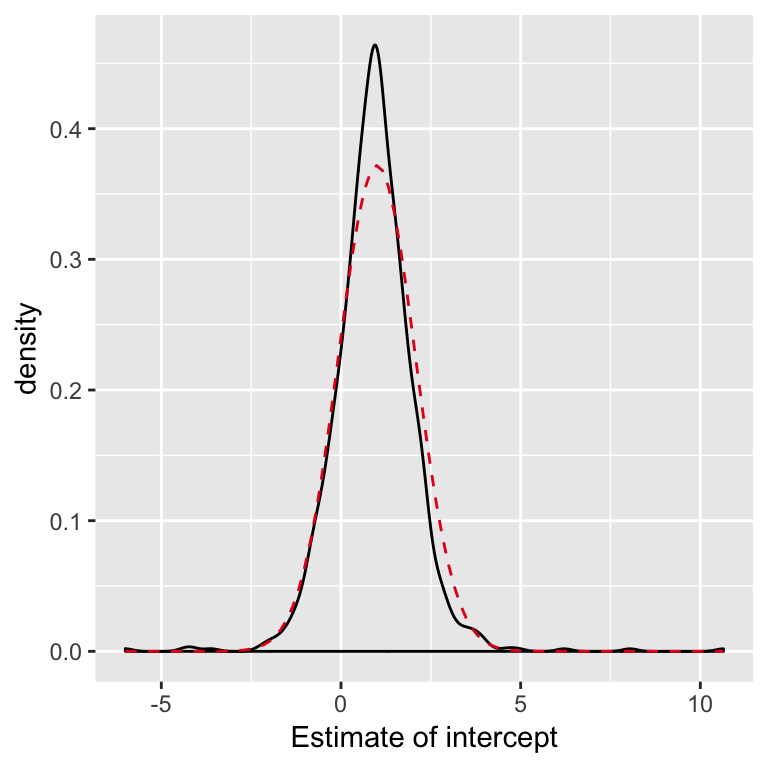
Examine distribution of estimates
High level: bootstrap idea
We don’t know the distribution of the errors, but our best guess is probably the empirical c.d.f on the residuals.
Sampling from a random variable with a c.d.f. defined as the empirical c.d.f. of the residuals, boils down to sampling with replacement from residuals.
Limitations
We might rely on bootstrap confidence intervals when we are worried about the assumption of Normal errors. But, there are limitations.
- We still rely on the assumption that the errors are independent and identically distributed.
- Generally scaled residuals are used (residuals don’t have the same variance, more later)
- An alternative bootstrap resamples the \((y_i, x_{i1}, \ldots, x_{ip})\) vectors, i.e. resamples the rows of the data, a.k.a resampling cases bootstrap.